SP500 LDN TRADING UPDATE 20/1/26

SP500 LDN TRADING UPDATE 20/1/26
WEEKLY & DAILY LEVELS
***QUOTING ES1! FOR CASH US500 EQUIVALENT LEVELS, SUBTRACT POINT DIFFERENCE***
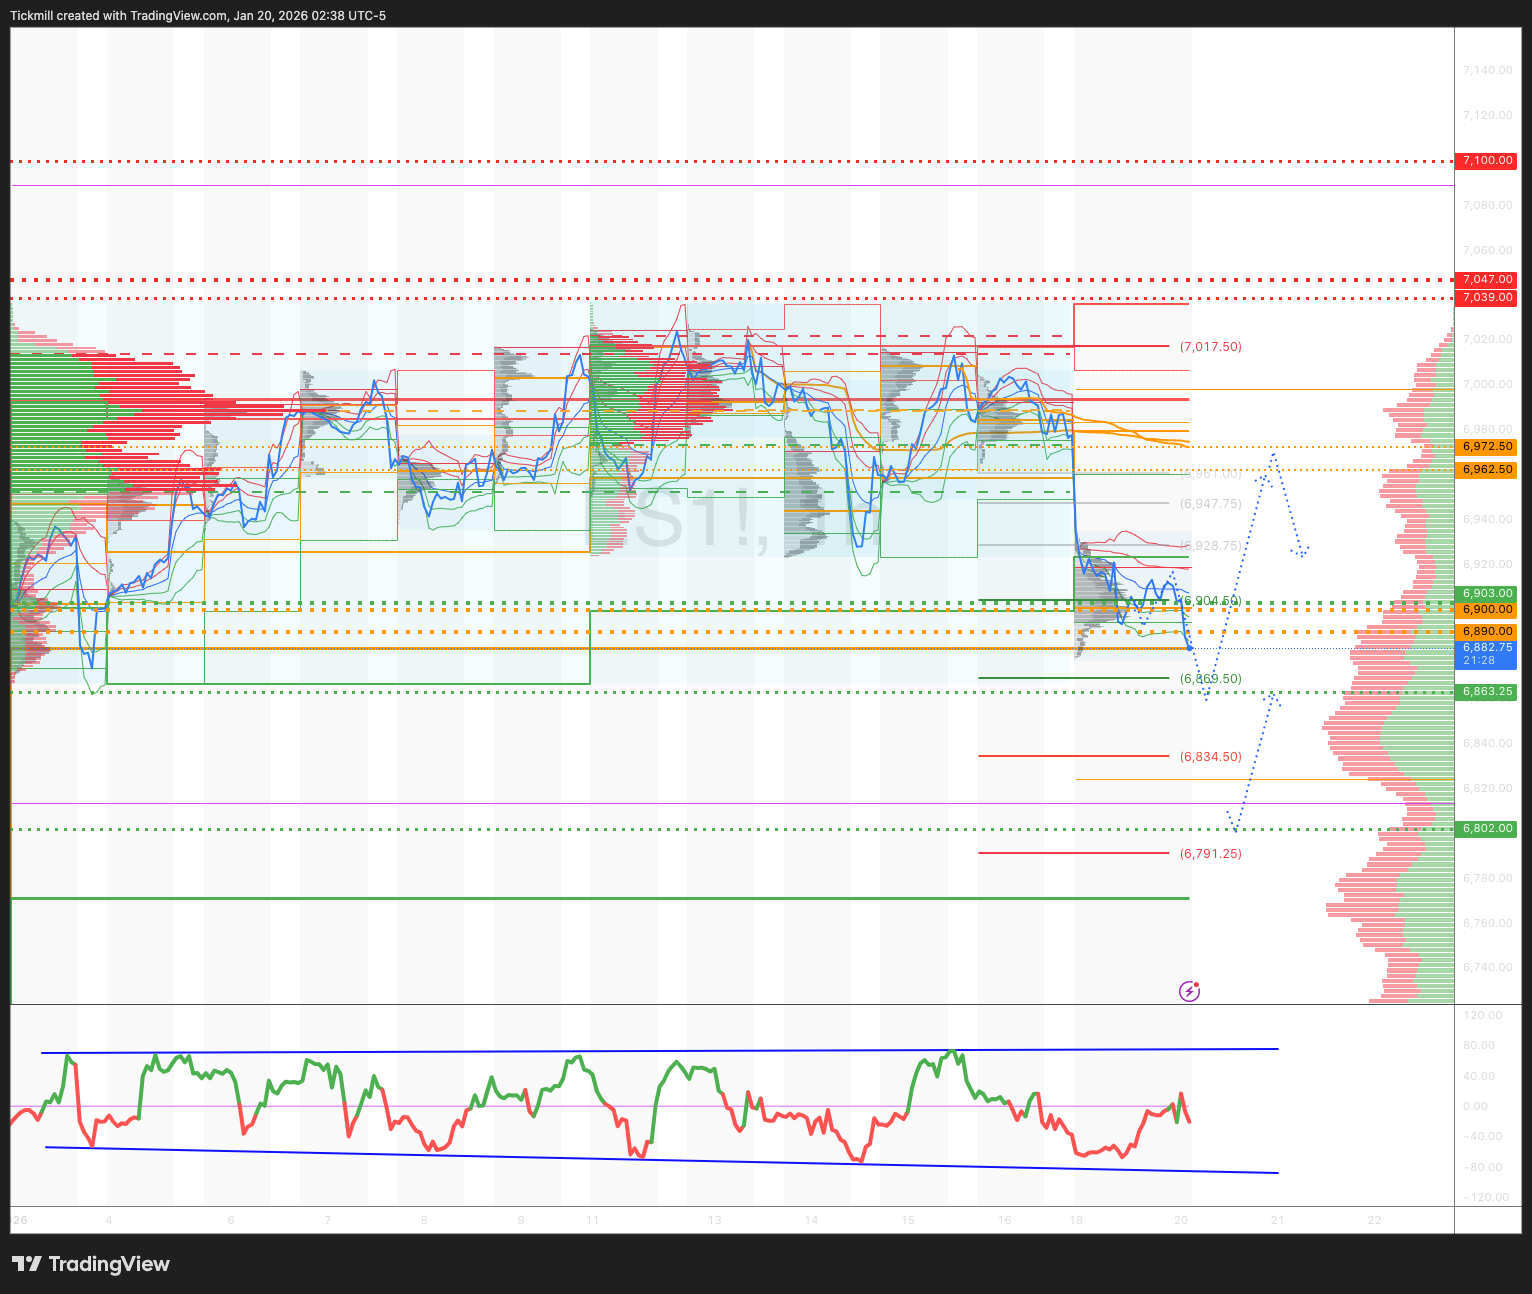
WEEKLY BULL BEAR ZONE 6900/6890
WEEKLY RANGE RES 7047 SUP 6903
FEB OPEX STRADDLE 6726/7154
MAR QOPEX STRADDLE 6466/7203
DEC 2026 OPEX STRADDLE 5889/7779
The area around the SPX aggregate gamma flip is at 6940. While the upside gamma is pronounced, it has somewhat smoothed since last week's vertical surface. The index has more leeway to rise. Based on the most recent analysis (Friday AH), the steep surface develops around 7030.
WEEKLY VWAP BULLISH 6969
MONTHLY VWAP BULLISH 6850
WEEKLY STRUCTURE – BALANCE - 6923/7025
MONTHLY STRUCTURE – ONE TIME FRAMING HIGHER - 6775
DAILY VWAP BEARISH 6979
DAILY STRUCTURE – BALANCE - 6923/7025
DAILY BULL BEAR ZONE 6952.5/62.5
DAILY RANGE RES 7039 SUP 6863
2 SIGMA RES 7100 SUP 6802
VIX BULL BEAR ZONE 17.7
PUT/CALL RATIO 1.20
TRADES & TARGETS
LONG ON RECLAIM WEEKLY BULL BEAR ZONE TARGET DAIL BULL BEAR ZONE
SHORT ON REJECT RECLAIM DAILY BULL BEAR ZONE TARGET DAILY RANGE SUPPORT
(I FADE TESTS OF 2 SIGMA LEVELS ESPECIALLY INTO THE FINAL HOUR OF THE NY CASH SESSION AS 90% OF THE TIME WHEN TESTED THE MARKET WILL CLOSE ABOVE OR BELOW THESE LEVELS)
GOLDMAN SACHS TRADING DESK VIEW - “US WEEKLY KICKSTART”
Value outperformance driven by valuation dispersion: Value factor returned +15% in 2H 2025 (90th percentile since 1980), fueled by 182% P/E premium for high-valuation stocks vs. 97% historical median, widest spreads in Comm Services/Info Tech/Financials.
GDP growth catalyst for Value: Goldman Sachs forecasts US GDP growth >3% in 1H 2026; Value factor historically delivers 14% avg return during accelerating growth (vs. 7% in stable periods).
Critical risk: Bond yield dynamics: Rising yields from non-growth factors (e.g., Fed policy concerns) risk rotation to "quality" stocks, threatening Value performance despite Fed easing.
Investor positioning gap: Hedge funds 10 pp underweight Value (vs. 5 pp avg 20y), while large-cap mutual funds overweight (88th percentile since 2014), creating asymmetric opportunity.
Sector valuation spreads signal opportunity: Widest dispersion in Comm Services (243% ROE spread) and Info Tech (197%), with Utilities showing tight spreads (limited Value play).
Policy & growth alignment: Accelerating growth + accommodative monetary policy may narrow dispersion, but AI adoption sustains wider spreads (20% overlap with GS AI basket), limiting Value rally duration.
Historical performance benchmark: Value outperforms by 7% avg in accelerating growth (14% vs. 7% stable), with current valuation spreads (18% P/E premium) historically preceding rallies.
Disclaimer: The material provided is for information purposes only and should not be considered as investment advice. The views, information, or opinions expressed in the text belong solely to the author, and not to the author’s employer, organization, committee or other group or individual or company.
Past performance is not indicative of future results.
High Risk Warning: CFDs are complex instruments and come with a high risk of losing money rapidly due to leverage. 69% and 73% of retail investor accounts lose money when trading CFDs with Tickmill UK Ltd and Tickmill Europe Ltd respectively. You should consider whether you understand how CFDs work and whether you can afford to take the high risk of losing your money.
Futures and Options: Trading futures and options on margin carries a high degree of risk and may result in losses exceeding your initial investment. These products are not suitable for all investors. Ensure you fully understand the risks and take appropriate care to manage your risk.
Patrick has been involved in the financial markets for well over a decade as a self-educated professional trader and money manager. Flitting between the roles of market commentator, analyst and mentor, Patrick has improved the technical skills and psychological stance of literally hundreds of traders – coaching them to become savvy market operators!