S&P500 Daily Action Areas & Price Targets 8/9/26

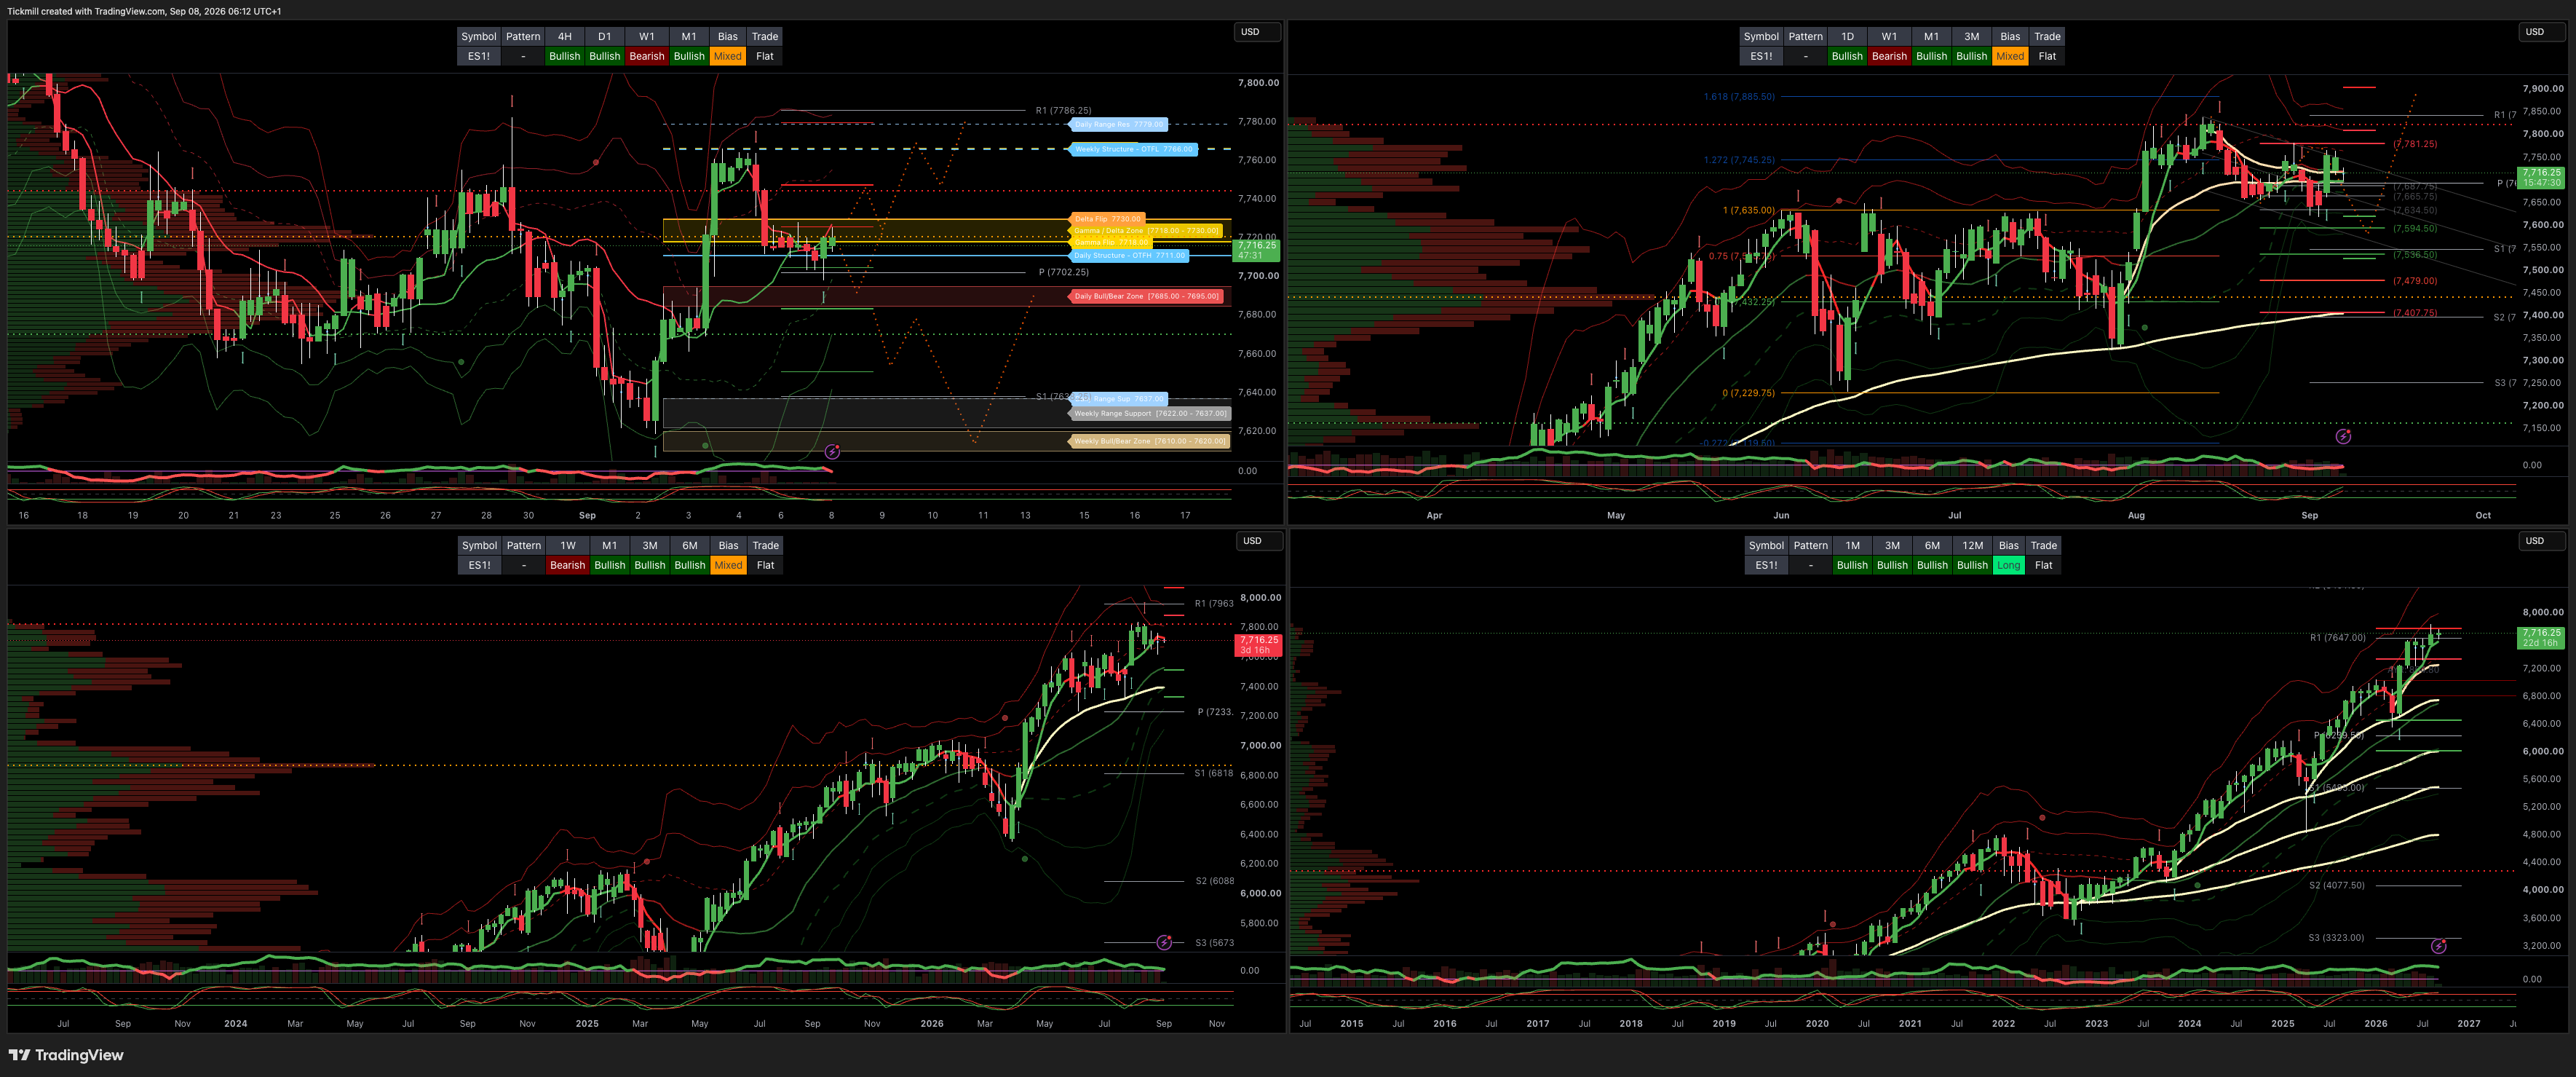
S&P500 Daily Action Areas & Price Targets 8/9/26
***QUOTING ES1! FOR CASH US500 EQUIVALENT LEVELS, SUBTRACT POINT DIFFERENCE***
MONTHLY-WEEKLY& DAILY LEVELS
MONTHLY BULL BEAR ZONE 7440/7400
MONTHLY RANGE RES 7882 SUP 7490
WEEKLY BULL BEAR ZONE 7620/10
WEEKLY RANGE RES 7821/07 SUP 7637/22
DAILY BULL BEAR ZONE 7695/85
DAILY RANGE RES 7779 SUP 7637
2 SIGMA RES 7850 SUP 7566
GAMMA FLIP 7718
DELTA FLIP 7730
GAP FILL 7766.25
DAILY STRUCTURE - OTFH - 7711
WEEKLY STRUCTURE - OTFL - 7766
MONTHLY STRUCTURE - OTFH - 7542
VIX BULL BEAR ZONE 17.3 (VVIX / VIX) 5.74
PRIMARY TRADE & TARGETS
LONG ON REJECT/RECLAIM DBBZ TARET DAILY RANGE RES
***ADDITIONAL SETUPS & TARGETS HIGHLIGHTED ON THE CHARTS***
(I FADE TESTS OF 2 SIGMA LEVELS ESPECIALLY INTO THE FINAL HOUR OF THE NY CASH SESSION AS 90% OF THE TIME WHEN TESTED THE MARKET WILL CLOSE ABOVE OR BELOW THESE LEVELS)
SPX PUT/CALL RATIO 1.05 (The numbers reflect options traded during the current session.) A put-call ratio below 0.7 is generally considered bullish, and a put-call ratio above 1.0 is generally considered bearish.
GS Flow Desk: large S&P 31Aug 7000/7950 strangle in roughly $20mm vega / $115mm premium …My Read – classic “big convexity versus carry” trade: either someone paid a lot to own a wide August move, or someone got paid a lot to bet that the S&P stays comfortably inside the 7000–7950 corridor
JHEQX Q3 Collar Short Call Cap: ~7,750 – 7,900 - Long Put Strike: ~7,050 – 7,100 (approx. 5% downside protection) Short Put Strike: ~5,950
DEC2025 OPEX to DEC2026 OPEX is 945 points giving us a range of [5889,7779]
Notes On Structure Implications
Balance: This refers to a market condition where prices move within a defined range, reflecting uncertainty as participants await further market-generated information. Our approach to balance includes favouring fade trades at the range extremes (highs/lows) while preparing for potential breakout scenarios if the balance shifts.
One-Time Framing Higher (OTFH): This represents a market trend where each successive bar forms a higher low, signalling a strong and consistent upward movement.
One-Time Framing Lower (OTFL): This describes a market trend where each successive bar forms a lower high, indicating a pronounced and steady downward movement.
GOLDMAN SACHS FICC & EQUITY TRADING DESK VIEWS
EQUITY, VOL & MACRO DESK BRIEFING
Market Tone: Post-Summer Volatility Inflection | 10Y/30Y Yields: ~4.7% / 5.2%+ | MOVE Index: 73 (14th %ile) | SPX Realized Corr: 11
THE TAKE: POST-SUMMER LIQUIDITY DRAIN & VOLATILITY COILING
As post-Labor Day seasonality takes hold, market activity is set to inflect sharply higher through year-end. Friday marked the year's lowest cash volume session (MVOLUSE), lowest intraday VIX (13.8), and near-record low single-stock implied volatility (~30.5). However, a dense macro/catalyst stack (PPI/CPI, 60% September Fed hike probability, US midterms, AI releases, heavy supply, and geopolitical tail risks) threatens to violently uncoil compressed implied volatility.
DESK THEMES & CROSS-ASSET FLOWS
1. Fed Policy & Inflation Sensitivity (The Sept 16 Dilemma)
Hike Probability Spike: OIS markets now price a 60% probability of a rate hike on Sept 16 (up from ~30% pre-Jackson Hole), directly challenging the GS house view of "no hike."
Data Catalysts: Tuesday’s PPI and Friday’s CPI are the definitive macro gatekeepers.
Options Mispricing: The SPX Friday straddle is priced at just 100bps. Given historical CPI sensitivity, options desks view this straddle pricing as dangerously cheap, offering "3 days of free gamma" before the data releases.
2. Rates & Duration Pressure (30Y Yield Stress)
Long-End Breakout: The 30-year yield 1-month average has broken above 5.2% (first sustained run since 2003), driven by sticky inflation, heavy Treasury issuance, and rebuilding term premium.
Tightening Financial Conditions: Rising long-end rates threaten long-duration assets and highly leveraged balance sheets even if the Fed stays on hold.
Vol Disconnect: The MOVE index closed at 73 (14th percentile on a 5-year lookback), opening highly attractive rate vs. equity dual option structures (sub-10th percentile pricing).
3. Volatility Dynamics & Extreme Correlation Compression
Realized Correlation at Record Lows: SPX 6-month realized correlation collapsed to 11—a level seen only twice in 25 years (Feb 2007 and Jan 2018 pre-"Volmageddon"). History indicates low-correlation regimes end in sharp index vol convexity ("starburst" events).
Tech Implieds Reset: Volatility across Software, Semis, and Internet has reset from "eyewateringly expensive" to "extremely reasonable," driving institutional demand into single-stock options, custom basket options, and ETF call structures.
Vol Scatter Insight (March to Sept Realized vs. Implied): Single-stock high-implied-volatility names consistently out-realized their higher volatility hurdles, while low-implied-volatility names under-realized lower hurdles—demonstrating that low nominal implied vol is not inherently cheap.
4. Positioning & Equity Market Behavior
De-risking Footprint: GS PB highlights that aggregate Net and Gross leverage levels have retraced back to post-Liberation Day lows (Apr–May 2025).
Asymmetric Rally Dynamics: Low structural positioning is creating an "under-allocated" tape. SPX rallies have exhibited nearly twice the volatility of sell-offs, with SPX call implieds showing unusually high correlation to SPX spot prices. Sell-side conference season could trigger meaningful upside chase flows.
MACRO & VOLATILITY MATRIX
Macro & Volatility Dimension | Current Level / Metric | Historical Context / Percentile | Tactical Implications & Desk Views |
SPX Realized Correlation | 11 | 25-Year Lows (Feb 2007, Jan 2018) | Coiled index volatility; prime setup for correlation dispersion/starburst trades |
30-Year Treasury Yield | > 5.2% (1m Avg) | Highest sustained level since 2003 | Pressure on long duration & leveraged debt; tightens financial conditions |
MOVE Index (Rates Vol) | 73 | 14th Percentile (5-Year Lookback) | Sub-10th percentile rate vs. equity dual options offer cheap macro hedges |
SPX Friday CPI Straddle | 100 bps | Suppressed vs. historical CPI events | Long gamma/straddles offer attractive risk/reward ahead of PPI/CPI print |
GS PB Net & Gross Leverage | Multi-Month Lows | Equivalent to Apr–May 2025 lows | Under-positioned street fuels volatile "up-crashes" and high spot-vol correlation |
TACTICAL PORTFOLIO ACTION
Capitalize on Cheap Options Volatility: Buy SPX straddles/strangles ahead of Friday CPI; structure upside call spreads across AI/Semis/Software where implieds have reset.
Hedge Duration Risk: Utilize rate-versus-equity dual option structures to protect against 30Y yields pushing above 5.25%.
Exploit Correlation Unwind: Trade index vol convexity and single-stock dispersion strategies to capture the inevitable correlation mean-reversion from historical lows of 11.
Disclaimer: The material provided is for information purposes only and should not be considered as investment advice. The views, information, or opinions expressed in the text belong solely to the author, and not to the author’s employer, organization, committee or other group or individual or company.
Past performance is not indicative of future results.
High Risk Warning: CFDs are complex instruments and come with a high risk of losing money rapidly due to leverage. 68% and 74% of retail investor accounts lose money when trading CFDs with Tickmill UK Ltd and Tickmill Europe Ltd respectively. You should consider whether you understand how CFDs work and whether you can afford to take the high risk of losing your money.
Futures and Options: Trading futures and options on margin carries a high degree of risk and may result in losses exceeding your initial investment. These products are not suitable for all investors. Ensure you fully understand the risks and take appropriate care to manage your risk.
Patrick has been involved in the financial markets for well over a decade as a self-educated professional trader and money manager. Flitting between the roles of market commentator, analyst and mentor, Patrick has improved the technical skills and psychological stance of literally hundreds of traders – coaching them to become savvy market operators!