S&P500 Trading Update 17/4/26

S&P500 Trading Update 17/4/26
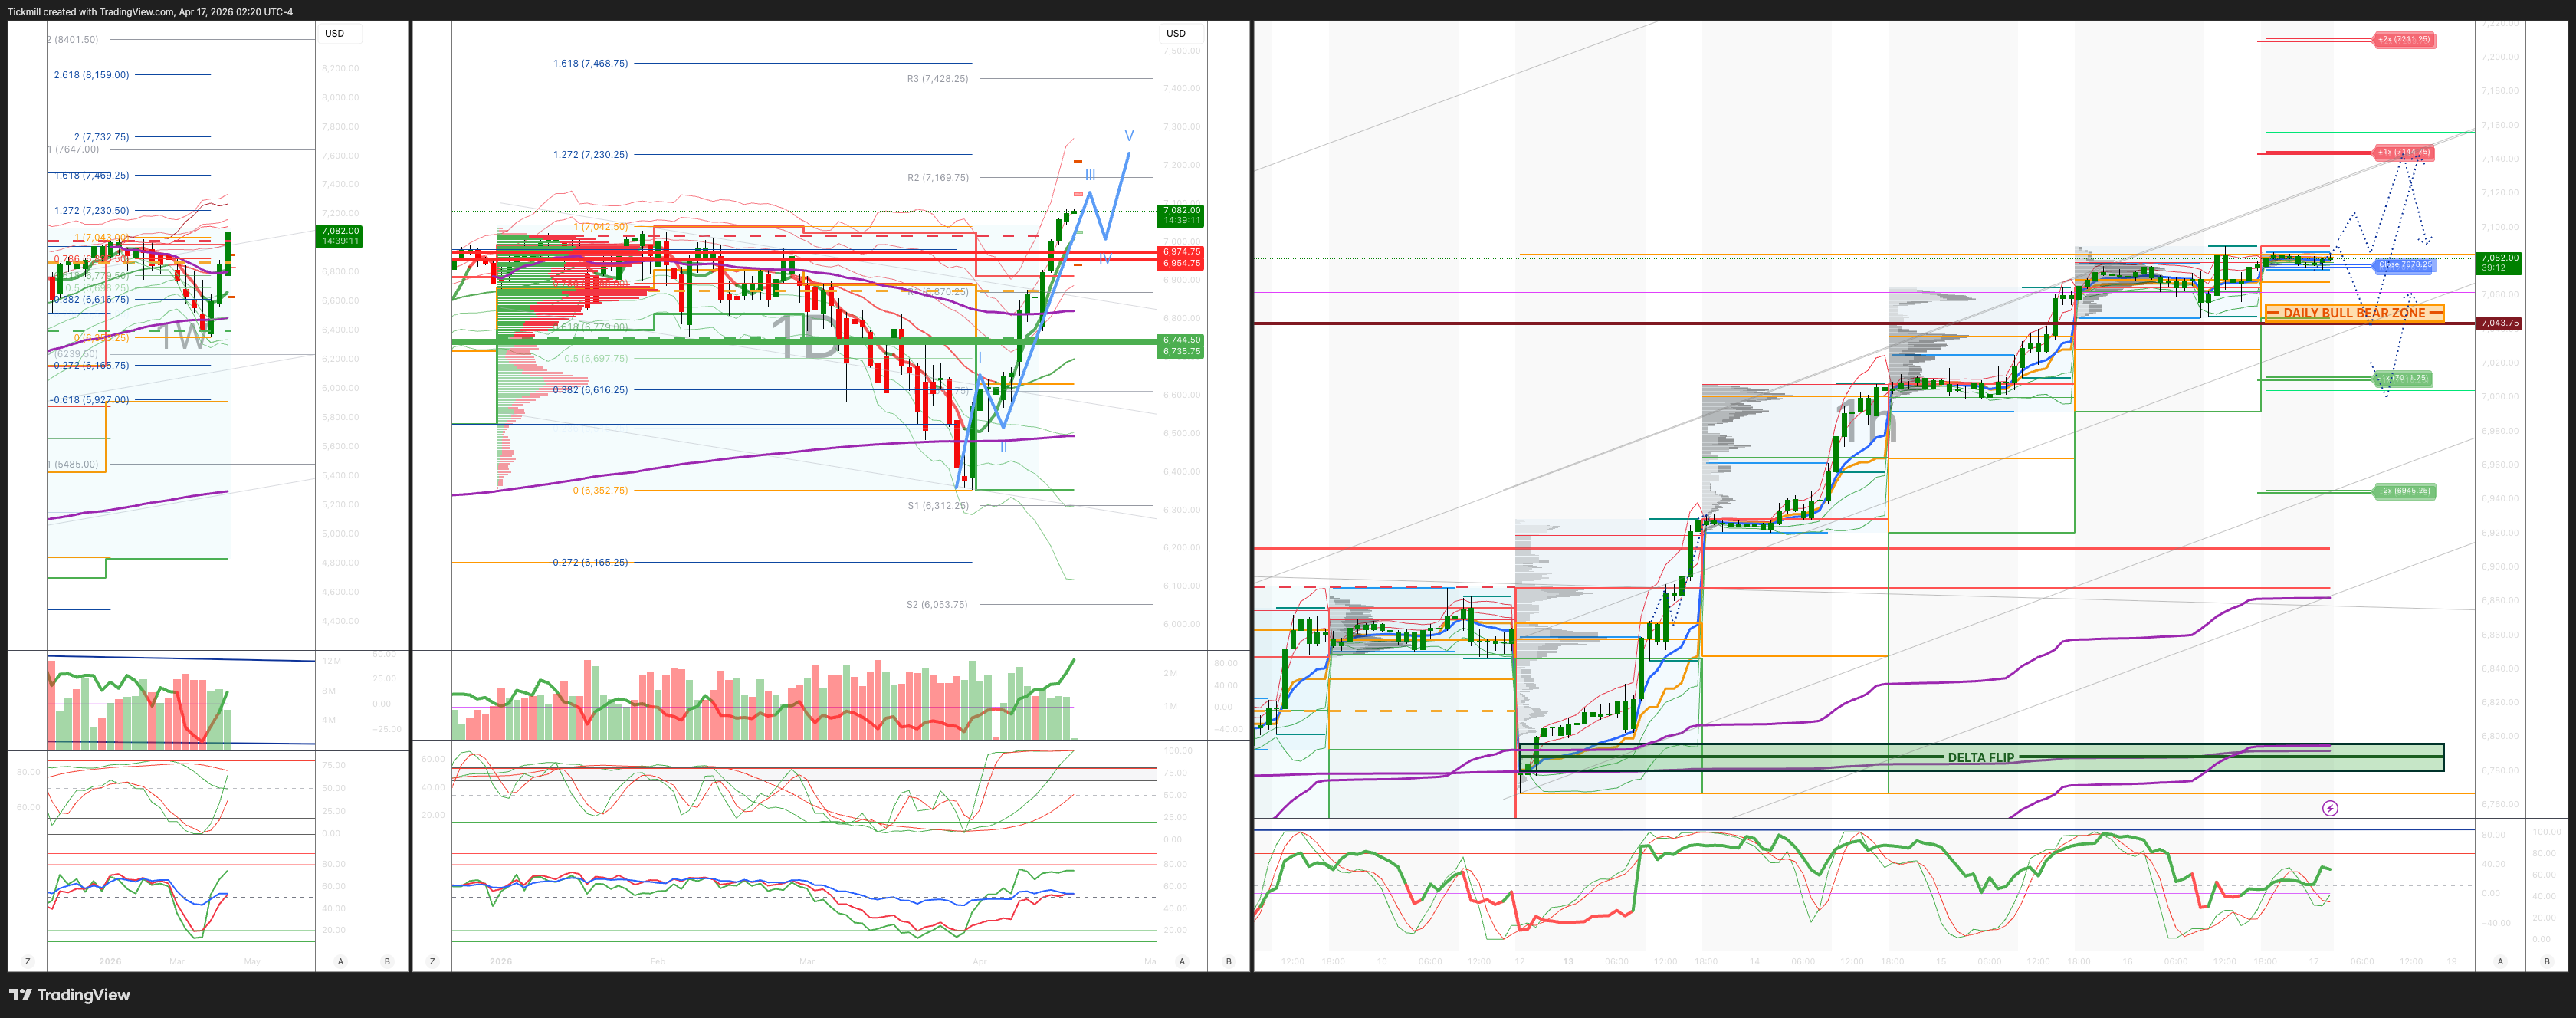
***QUOTING ES1! FOR CASH US500 EQUIVALENT LEVELS, SUBTRACT POINT DIFFERENCE***
WEEKLY BULL BEAR ZONE 6730/20
WEEKLY RANGE RES 6745/35 SUP 6955/75
April OPEX Straddle: 328.55pt range implies a OPEX to OPEX range of [6177, 6835]
June QOPEX Straddle is 546.4pt giving us a range of [5960,7052]
JHEQX Q2 Collar 6189/6290 - 6865/6955
DEC2025 OPEX to DEC2026 OPEX is 945 points giving us a range of [5889,7779]
SPX PUT/CALL RATIO 1.11 (The numbers reflect options traded during the current session. A put-call ratio below 0.7 is generally considered bullish, and a put-call ratio above 1.0 is generally considered bearish)
DAILY VWAP BULLISH 7017
WEEKLY VWAP BULLISH 6656
MONTHLY VWAP BULLISH 6815
DAILY STRUCTURE – OTFH - 7004
WEEKLY STRUCTURE – OTFH
MONTHLY STRUCTURE - OTFD - BALANCE
Balance: This refers to a market condition where prices move within a defined range, reflecting uncertainty as participants await further market-generated information. Our approach to balance includes favouring fade trades at the range extremes (highs/lows) while preparing for potential breakout scenarios if the balance shifts.
One-Time Framing Higher (OTFH): This represents a market trend where each successive bar forms a higher low, signalling a strong and consistent upward movement.
One-Time Framing Down (OTFD): This describes a market trend where each successive bar forms a lower high, indicating a pronounced and steady downward movement.
DAILY BULL BEAR ZONE 7045/55
DELTA FLIP 6788
DAILY RANGE RES 7144 SUP 7011
2 SIGMA RES 7211 SUP 6945
VIX BULL BEAR ZONE 19.5
TRADES & TARGETS
LONG ON REJECT/RECLAIM OF DAILY BULL BEAR ZONE TARGET DAILY RANGE RES
***ADDITIONAL SETUPS & TARGETS HIGHLIGHTED ON THE CHARTS***
(I FADE TESTS OF 2 SIGMA LEVELS ESPECIALLY INTO THE FINAL HOUR OF THE NY CASH SESSION AS 90% OF THE TIME WHEN TESTED THE MARKET WILL CLOSE ABOVE OR BELOW THESE LEVELS)
GOLDMAN SACHS TRADING DESK VIEW - ‘Winning Streak’
.US Equities / Derivatives Wrap
US equities closed modestly higher on Thursday, with the S&P 500 up 0.26% to a record 7,041, extending its winning streak to 12 straight sessions. The move was supported by further signs of Middle East de-escalation, generally solid earnings, and ongoing CTA re-risking. The close was accompanied by a $4.9bn MOC buy imbalance, suggesting demand remained firm into the bell.
Across the major indices, the Nasdaq 100 rose 0.49% to 26,333, the Russell 2000 gained 0.22% to 2,720, and the Dow added 0.24% to 48,579. Trading volumes were broadly in line with recent norms, with 19.2bn shares changing hands across US exchanges versus a YTD daily average of 19.4bn.
In cross-asset markets, the tone was mixed. VIX fell 1.27% to 17.94, while WTI crude jumped 2.39% to $93.47. US 10-year Treasury yields rose 3bps to 4.31%, the DXY added 0.15% to 98.21, gold was little changed, and Bitcoin rose 0.42% to $75,182.
Sector / flow takeaways
The key theme beneath the surface remains the sharp rotation between semiconductors and software. After semis outperformed software by roughly 25% last week, that relative move has started to reverse, with software rebounding around 7% this week, including a 5.5% move yesterday. Given how consensus positioning had been skewed, the earlier semi leadership was easier for investors to absorb than the recent reversal.
Desk flow suggests semiconductor activity has become more balanced this week following very strong inflows at the start of April. The main area of supply has been semi-cap equipment, particularly in the wake of developments around ASML and TSM. Elsewhere, the short squeeze remained a notable feature of the tape, with crowded shorts outperforming popular hedge fund longs by 136bps.
Primary market / desk colour
The session also saw strong IPO debuts. Madison Air Solutions (MAIR) priced at $27 and closed at $31.75, while Arxis (ARXS) priced at $28 and finished at $38.75. Both names attracted overlapping demand from asset managers and hedge funds, which helped drive net buying on the day.
In terms of overall market tone, desk activity was described as moderately active, with the floor at roughly a 6 out of 10. The desk finished net to buy, around +225bps versus a 30-day average near flat, though outside the IPOs, single-stock flow was generally more muted.
Post-close: Netflix
After the bell, Netflix initially fell around 8%, as weaker-than-expected guidance overshadowed a solid quarterly print relative to elevated market expectations. Q1 revenue came in slightly ahead of consensus at $12.25 billion versus $12.17 billion expected, but Q2 revenue, EPS, and margin guidance were all disappointing, with the company citing higher content amortisation. Full-year revenue guidance of +12–14% was maintained, which was in line with expectations, although some investors had hoped for an upward revision following recent price increases. The absence of any increase in the buyback also appears to have weighed on sentiment. Separately, co-founder Reed Hastings is set to leave the board at the end of his term.
Derivatives
In derivatives, the market continued to exhibit a spot-up, vol-up pattern for a third consecutive session, even as the S&P closed at another all-time high. Dealers are still thought to be long gamma, although that support may fade if the market extends further higher.
Skew compressed across the curve, most notably in the front end, as buyers of short-dated downside protection gave way to sellers further out the curve around the one-year tenor. The shift has been significant: 1-month put-call skew has dropped from around the 90th percentile in March to the 36th percentile now.
Flow-wise, the market saw IWM hedges roll higher, alongside continued monetisation of tech volatility. Heading into April expiry, the market is pricing a 51bp straddle, the lowest level since February, highlighting just how sharply near-term implied volatility has retraced.
Disclaimer: The material provided is for information purposes only and should not be considered as investment advice. The views, information, or opinions expressed in the text belong solely to the author, and not to the author’s employer, organization, committee or other group or individual or company.
Past performance is not indicative of future results.
High Risk Warning: CFDs are complex instruments and come with a high risk of losing money rapidly due to leverage. 69% and 73% of retail investor accounts lose money when trading CFDs with Tickmill UK Ltd and Tickmill Europe Ltd respectively. You should consider whether you understand how CFDs work and whether you can afford to take the high risk of losing your money.
Futures and Options: Trading futures and options on margin carries a high degree of risk and may result in losses exceeding your initial investment. These products are not suitable for all investors. Ensure you fully understand the risks and take appropriate care to manage your risk.
Patrick has been involved in the financial markets for well over a decade as a self-educated professional trader and money manager. Flitting between the roles of market commentator, analyst and mentor, Patrick has improved the technical skills and psychological stance of literally hundreds of traders – coaching them to become savvy market operators!